

The Bullish Engulfing Pattern serves as a bullish reversal candlestick, manifesting following a price decline.
Identifying this pattern involves noting the following characteristics:
- The initial candle concludes with a lower close.
- The second candle’s body effectively “engulfs” the body of the preceding candle.
Understanding the Bullish Engulfing Pattern involves recognizing the following dynamics:
- During the first candle, sellers dominate, exerting downward pressure on the price.
- Shortly thereafter, buyers enter the market, propelling the price upward and overpowering the earlier selling influence.
It’s important to note that a Bullish Engulfing candlestick and a Hammer are essentially identical, contingent upon the timeframe under consideration.
For instance, if a Bullish Engulfing Pattern emerges in the 2-hour timeframe, the candlestick pattern on the 4-hour timeframe will correspondingly appear as a Hammer.
Here’s a visual representation of what I mean…

Fundamentally, a Bullish Engulfing Pattern (or Hammer) indicates that, at present, the buyers are holding sway.
However, the sustainability of their dominance hinges on the market context, a topic we’ll delve into shortly.
Don’t make this common mistake when trading the Bullish Engulfing Pattern
“Observe. A Bullish Engulfing Pattern has emerged. This signals strength, prompting us to initiate a purchase!”
However, unexpectedly, the market takes a turn, and you find yourself stopped out, incurring a loss.
Why does this happen?
The reality is, that a Bullish Engulfing Pattern typically signifies a retracement within a downtrend.
Allow me to illustrate this point with the help of an example:
Bullish Engulfing Pattern identified on the Daily timeframe:

On the lower timeframe, it’s a retracement against the trend…

Indeed, the presence of a Bullish Engulfing Pattern indicates a temporary ascendancy of buyers. However, if the overall trend leans towards a downward trajectory, sellers will probably reclaim control, propelling the price downward. The key question now is how to effectively trade the Bullish Engulfing Pattern, and that’s what we’ll explore in the following section.
Keep reading…
Bullish Engulfing Pattern | The MAEE Formula
This bullish engulfing strategy employs the MAEE Formula, which breaks down as follows:
(M) Market Structure:
Start by determining the prevailing market structure. Is it in an uptrend, downtrend, or moving within a range?
(A) Area of Value:
Identify the area of value to pinpoint potential zones, where buying or selling pressure might come into play. This could involve factors like Support & Resistance, Moving Averages, Trendlines, Channels, etc.
(E) Entry Trigger:
Subsequently, find a valid entry trigger to initiate the trade, such as the bullish engulfing candle. Candlestick patterns are instrumental here, as they reveal the current controlling party, whether it’s the buyers or sellers. For instance, a Bullish Engulfing Pattern signifies that buyers currently hold sway.
(E) Exits:
Lastly, determine where to exit the trade in case the price moves in your favour or against you. Establish your stop-loss and target profit levels because a comprehensive bullish engulfing strategy necessitates a well-defined exit plan.
Now, acknowledging that this information may be overwhelming, let me illustrate the MAEE formula with a few examples…
A winning trade based on the MAEE Formula on the USD/CHF 4-hour Chart:

MAEE formula winning trade on the EUR/CAD Daily Chart:

MAEE formula unsuccessful trade on the GBP/AUD Daily Chart utilizing the engulfing candle strategy.

How to Utilize the Bullish Engulfing Pattern for Precision in Capturing Market Bottoms?
In addition to employing the Bullish Engulfing Pattern as an entry trigger, it can also serve as a signal for potential opportunities in trend reversal trading within an engulfing trading strategy.
Here’s the underlying concept:
As established, a Bullish Engulfing Pattern suggests a temporary ascendancy of buyers. Therefore, when this pattern manifests on a higher timeframe (such as the Weekly timeframe) and aligns with a significant area of value (like a Support level), it signifies a potential market reversal towards an upward trend.
However, a consideration arises:
Trading on the Weekly timeframe might not be desirable due to the necessity of a sizable stop loss. The solution is to transition to a lower timeframe and strategically time your entry with the occurrence of a Bullish Engulfing candle.
Here’s the step-by-step process:
- Identify a Bullish Engulfing Pattern aligned with an area of value on the Weekly timeframe.
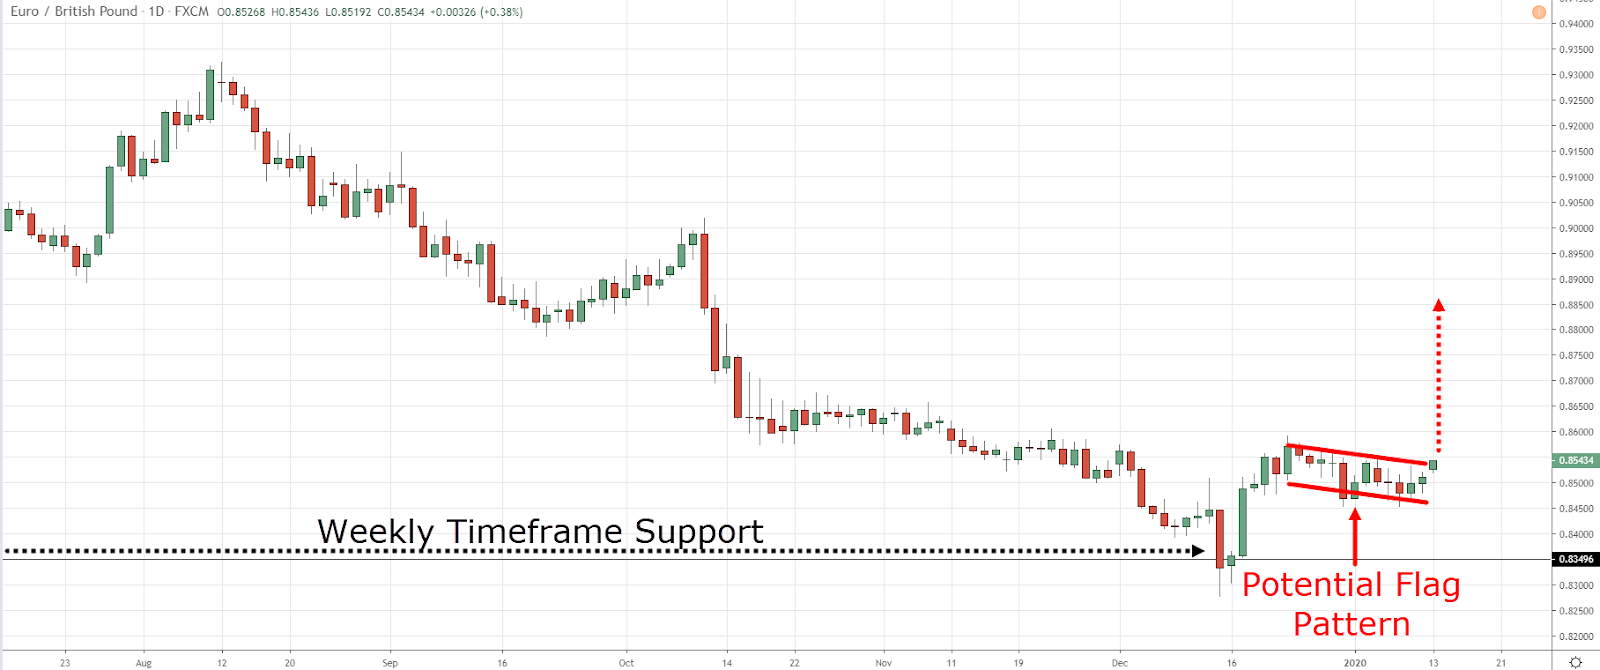
- Shift to the Daily or 8-hour timeframe and seek out bullish chart patterns (such as Bull Flag, Ascending Triangle, etc.).
- Execute the trade upon the breakout of the bullish chart pattern.
Illustrative Example:
Bullish Engulfing observed on the EUR/GBP Weekly Chart:

Potential Bull Flag Pattern on the EUR/GBP Daily Chart:
2 Things You Must Look for When Trading the Bullish Engulfing Pattern…
Number 1: Indicators of an Impending Strong Momentum Move within a Region. Anticipating a Robust Momentum Move within a Region
Consider this:
When you opt to buy at a Support level, would you rather have the closest swing high (or Resistance) be in proximity or at a distance?
Ideally, you’d prefer it to be at a distance, enhancing the profit potential before encountering selling pressure.
Now, the question arises – how can you pinpoint such trading opportunities? The answer to that question comes from identifying instances where a robust momentum enters the Support level.
Here’s an example:

However, if you get a “Stair-Stepping” move into Support, the price will encounter selling pressure shortly after the rally (at the nearest swing high).
Here’s an illustration of what I mean…

So, if you trade reversals, always look for a strong momentum move into an area.
The bigger and bolder the candles, the better.
2. Strong Price Rejection:
Consider this aspect:
Not all instances of Bullish Engulfing Patterns possess the same significance.
As previously highlighted, a Bullish Engulfing Pattern typically denotes a retracement counter to the prevailing downtrend, particularly on a lower timeframe.
This holds particularly true when the size of the candle is diminutive or comparable to the preceding candles.
However, when the range of the Bullish Engulfing Pattern surpasses that of the earlier candles, it indicates a robust surge in buying pressure.
Additionally, upon closer examination of the lower timeframe, you are likely to observe a structural shift as the prices achieve higher highs and lows – another indication of the buyers’ strength.
Here’s an illustrative example of a potential price rejection…

Professional Tip:
If the Bullish Engulfing Pattern has a size equivalent to or exceeds 1.5 times the Average True Range (ATR), it is likely indicative of a robust price rejection. This serves as a method to quantify the strength of a price rejection.
Summary:
In summary, here’s a recap of what you’ve gained insight into today:
1) A Bullish Engulfing Pattern acts as a signal suggesting that buyers have a temporary ascendancy.
2) The MAEE Formula, encompassing Market Structure, Area of Value, Entry Trigger, and Exits.
3) The Bullish Engulfing Pattern can function as an effective entry trigger.
4) For identifying reversals with high probability, it’s beneficial to observe a forceful momentum entering the Support and a pronounced price rejection.
Conclusion:
In conclusion, mastering the Bullish Engulfing Pattern is pivotal for traders seeking profitable opportunities in the market. Armed with the MAEE Formula and key insights into price dynamics, traders can navigate the complexities of the market with confidence.
Remember, success in trading lies in understanding the market context, identifying high-probability setups, and executing trades with discipline.
Keep honing your skills, stay vigilant, and may your trading journey be filled with prosperity and success.
Stay tuned for more insightful blogs like this on our flagship website, www.hedged.in.
Happy trading! 📈
Leave a Reply