
Nestle Stock Price Analysis and Quick Research Report.
Stock investing requires careful analysis of financial data to find out the company’s true net worth. This is generally done by examining the company’s profit and loss account, balance sheet and cash flow statement. This can be time-consuming and cumbersome. An easier way to find out about a company’s performance is to look at its financial ratios, which can help to make sense of the overwhelming amount of information that can be found in a company’s financial statements.
Here are the few indispensable tools that should be a part of every investor’s research process.
- PE ratio: – Price to Earnings’ ratio, which indicates for every rupee of earnings how much an investor is willing to pay for a share. A general rule of thumb is that shares trading at a LOW P/E are undervalued (it depends on other factors too). Nestle has a PE ratio of 78.70 which is high and comparatively overvalued .
- Return on Assets (ROA): – Return on Assets measures how effectively a company can earn a return on its investment in assets. In other words, ROA shows how efficiently a company can convert the money used to purchase assets into net income or profits. Nestle has a ROA of 27.86 % which is a good sign for future performance. (higher values are always desirable)
- Current ratio: – The current ratio measures a company’s ability to pay its short-term liabilities with its short-term assets. A higher current ratio is desirable so that the company could be stable to unexpected bumps in business and economy. Nestle has a Current ratio of 1.13 .
- Return on equity: – ROE measures the ability of a firm to generate profits from its shareholders investments in the company. In other words, the return on equity ratio shows how much profit each rupee of common stockholders’ equity generates. Nestle has a ROE of 108.52 % .(higher is better)
- Debt to equity ratio: – It is a good metric to check out the capital structure along with its performance. Nestle has a D/E ratio of 0.01 which means that the company has low proportion of debt in its capital.
- Inventory turnover ratio: – Inventory Turnover ratio is an activity ratio and is a tool to evaluate the liquidity of a company’s inventory. It measures how many times a company has sold and replaced its inventory during a certain period of time. Nestle has an Inventory turnover ratio of 9.90 which shows that the management is inefficient in relation to its Inventory and working capital management.
- Sales growth: – Nestle has reported revenue growth of 14.63 % which is poor in relation to its growth and performance.
- Operating Margin: – This will tell you about the operational efficiency of the company. The operating margin of Nestle for the current financial year is 21.93 %.
- Dividend Yield: – It tells us how much dividend we will receive in relation to the price of the stock. The current year dividend for Nestle is Rs 220 and the yield is 0.91 %.
Nestle India Share Price ForecastNestle India Ltd. (NESTLEIND)
Forecast Chart, Long-Term Predictions for Next Months and Year: 2023, 2024
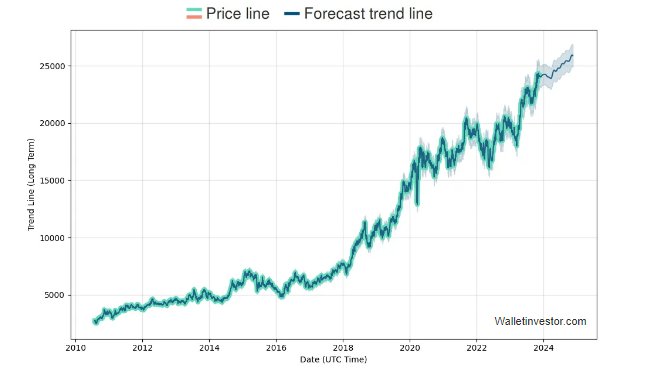
Nestle India Ltd. (NESTLEIND) Forecast Chart provides investors and analysts with a visual representation of the anticipated future performance of the company’s stock. This chart typically includes technical analysis indicators, trend lines, and other relevant data points to help stakeholders make informed decisions about buying, selling, or holding their investments.
Long-term predictions for the next months and years, particularly for the years 2023 and 2024, are crucial for investors who are looking to make strategic decisions about their portfolios. Analysts use a combination of fundamental and technical analysis to assess potential future scenarios for Nestle India Ltd. Factors considered in these predictions may include the company’s financial health, market conditions, industry trends, and global economic factors.
Nestle India Share Market
Nestle India Ltd.
24,373.45
70.90 (0.29%)


Nestle India Ltd. is a renowned multinational food and beverage company that operates in India. As of the latest available data, the stock price of Nestle India Ltd. stands at ₹24,373.45. This figure represents the current market value of one share of Nestle India Ltd. on the stock exchange.
The stock market is dynamic, and the value of stocks can fluctuate regularly. The percentage change is a measure of how much the stock price has moved in comparison to its previous value. In this case, the stock price has experienced a slight increase of 0.29%, indicating a modest positive change in the recent period.
Investors and market analysts closely monitor such fluctuations in stock prices as they provide insights into the financial health and performance of the company. Various factors, including market trends, economic conditions, and company-specific developments, can influence stock prices.
Nestle India Share Price Dividend
Nestle India Ltd Overview: Market Position and Share Performance
Nestle India Ltd, a globally renowned Consumer Defensive company, currently holds a substantial market capitalization of ₹2,34,981.97Cr. As of November 21, 2023, the company’s share price stands at ₹24,302.55.
Dividend Analysis: Evaluating Nestle India Ltd’s Payouts
Dividends, a crucial aspect for investors seeking steady returns, constitute a percentage of a company’s earnings distributed among shareholders. Nestle India Ltd, known for rewarding its shareholders, provided a dividend of ₹362 for the full year.
Recent Dividend Declarations and Yield
In the quarter ending June 2023, Nestle India Ltd announced a dividend of ₹140, resulting in a dividend yield of 1.49%. This move exemplifies the company’s commitment to sharing profits with its investors.
Financial Performance: Revenue and Profit Growth
Nestle India Ltd demonstrated robust financials in the quarter ending September 2023. The revenue reached ₹5,176.51Cr, reflecting a substantial 11.74% year-on-year growth. Simultaneously, profits soared to ₹908.08Cr, showcasing an impressive 37.28% increase compared to the previous quarter.
Key Dividend Metrics for Investors
To assess Nestle India Ltd’s suitability as a dividend stock, investors should consider crucial metrics. As of the last dividend payment on September 19, 2023, the current dividend yield stands at 1.49%, and the annual dividend payment sums up to ₹362.
In conclusion, Nestle India Ltd’s consistent dividend payouts, coupled with robust financial growth, position it as a compelling choice for investors seeking reliable returns in the Consumer Defensive sector.
Nestle India Share Price Target
The provided information indicates a price target projection for Nestle India Ltd. (NESTLEIND) over the next 14 days, presenting both an upside and a downside potential. Let’s elaborate on this:
The 14-day price target for NESTLEIND is forecasted to be at 24664.08 INR. This represents the potential upside, suggesting that the stock price could increase to this level within the specified time frame. Investors and analysts use price targets as a reference point to assess the potential for profit or growth in a given stock over a specific period.
Conversely, the downside potential is indicated to be 23962.42 INR. This implies the possible decrease in the stock price within the same 14-day period. The downside figure is crucial for investors as it provides insight into the potential risk associated with holding the stock during the specified time frame.
Price targets are often based on various factors, including technical analysis, market trends, and fundamental indicators. They serve as tools for investors to make informed decisions about entering or exiting positions, managing risk, and aligning their investment strategies with market expectations.
It’s important to note that price targets are projections and subject to change based on market dynamics and unforeseen events. Investors should exercise caution and conduct thorough research, considering various factors, before making investment decisions based on short-term price targets.
Nestle India Share Price In 2025
| Nestle India Ltd. Stock Price Forecast for 2025 | |||||
| January 2025 | 25950.93 | 25819.94 | 25819.94 | 25958.20 | -0.51 %▼ |
| February 2025 | 25775.57 | 25697.65 | 25697.65 | 25775.57 | -0.3 %▼ |
| March 2025 | 25669.34 | 25774.29 | 25554.81 | 25774.29 | 0.41 % ▲ |
| April 2025 | 25809.51 | 26284.70 | 25809.51 | 26332.49 | 1.81 % ▲ |
| May 2025 | 26273.41 | 26435.49 | 26187.70 | 26435.49 | 0.61 % ▲ |
| June 2025 | 26461.79 | 26553.34 | 26461.79 | 26553.34 | 0.34 % ▲ |
| July 2025 | 26573.52 | 26879.01 | 26573.52 | 26897.99 | 1.14 % ▲ |
| August 2025 | 26868.49 | 27118.04 | 26857.80 | 27119.31 | 0.92 % ▲ |
| September 2025 | 27123.48 | 27074.32 | 27068.45 | 27145.83 | -0.18 %▼ |
| October 2025 | 27093.17 | 27612.89 | 27093.17 | 27612.89 | 1.88 % ▲ |
| November 2025 | 27628.30 | 27407.26 | 27407.26 | 27650.47 | -0.81 %▼ |
| December 2025 | 27407.15 | 27640.83 | 27407.15 | 27640.83 | 0.85 % ▲ |
Nestle India Share Price History
In the tumultuous global stock market crash of 2020, Nestle’s resilience shone through as its share price experienced only a moderate dip of 10-12%, swiftly recovering in the aftermath. Nestle has established itself as a cornerstone in investment portfolios, distinguishing itself from stocks geared for short-term trading or seeking rapid, substantial returns.
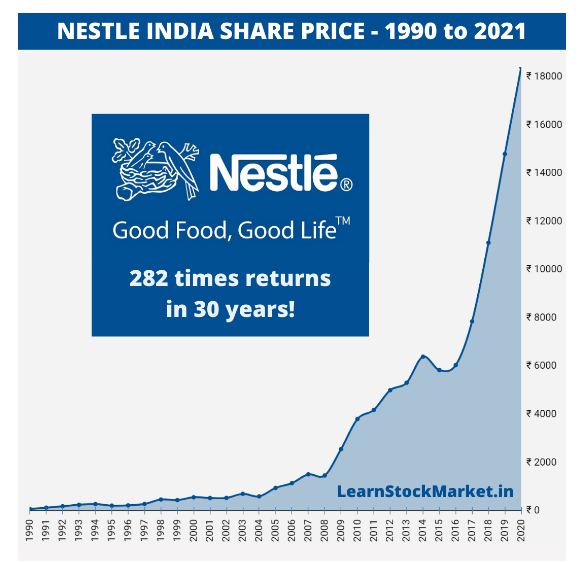
Over the past three decades, the Nestle Share Price has consistently demonstrated stability and reliability, embodying the company’s commitment to providing enduring value to its shareholders. Nestle, with its mantra of “Good Food and Good Life,” has emerged as a stalwart performer, fostering investor confidence through various market conditions.
An intriguing case in Nestle’s historical performance unfolded during the ‘Maggi ban’ crisis between 2015-16. Despite a substantial drop in share price at that time, astute investors recognized it as a unique opportunity. The company’s adept handling of the crisis proved pivotal, and those with unwavering conviction were handsomely rewarded. In the subsequent four years, the Nestle Share Price tripled, underscoring the potential for significant gains when holding firm during challenging periods.
In essence, Nestle’s track record not only weathering the storm of market crashes but also leveraging crises as opportunities for growth reaffirms its status as a steadfast, long-term investment rather than a vehicle for short-term speculation. The company’s ability to navigate challenges and consistently deliver value positions it as a reliable asset in the ever-evolving landscape of the stock market.
Conclusion
Nestle India’s stock analysis indicates strong fundamentals despite a high PE ratio. The current share price of ₹24,373.45 reflects a slight increase of 0.29%, showcasing market dynamics. With a commitment to dividends and robust financial performance, Nestle appears as a reliable choice for investors seeking steady returns. Short-term price targets suggest potential upsides and downsides, while the historical performance underscores Nestle’s resilience and long-term value in the stock market.
Nestle’s historical performance underscores its resilience, notably during crises like the ‘Maggi ban,’ where strategic handling led to substantial gains for steadfast investors. This track record positions Nestle India as a reliable asset in the ever-evolving stock market, emphasising its value for those prioritising stability and enduring returns over short-term speculation.
Leave a Reply