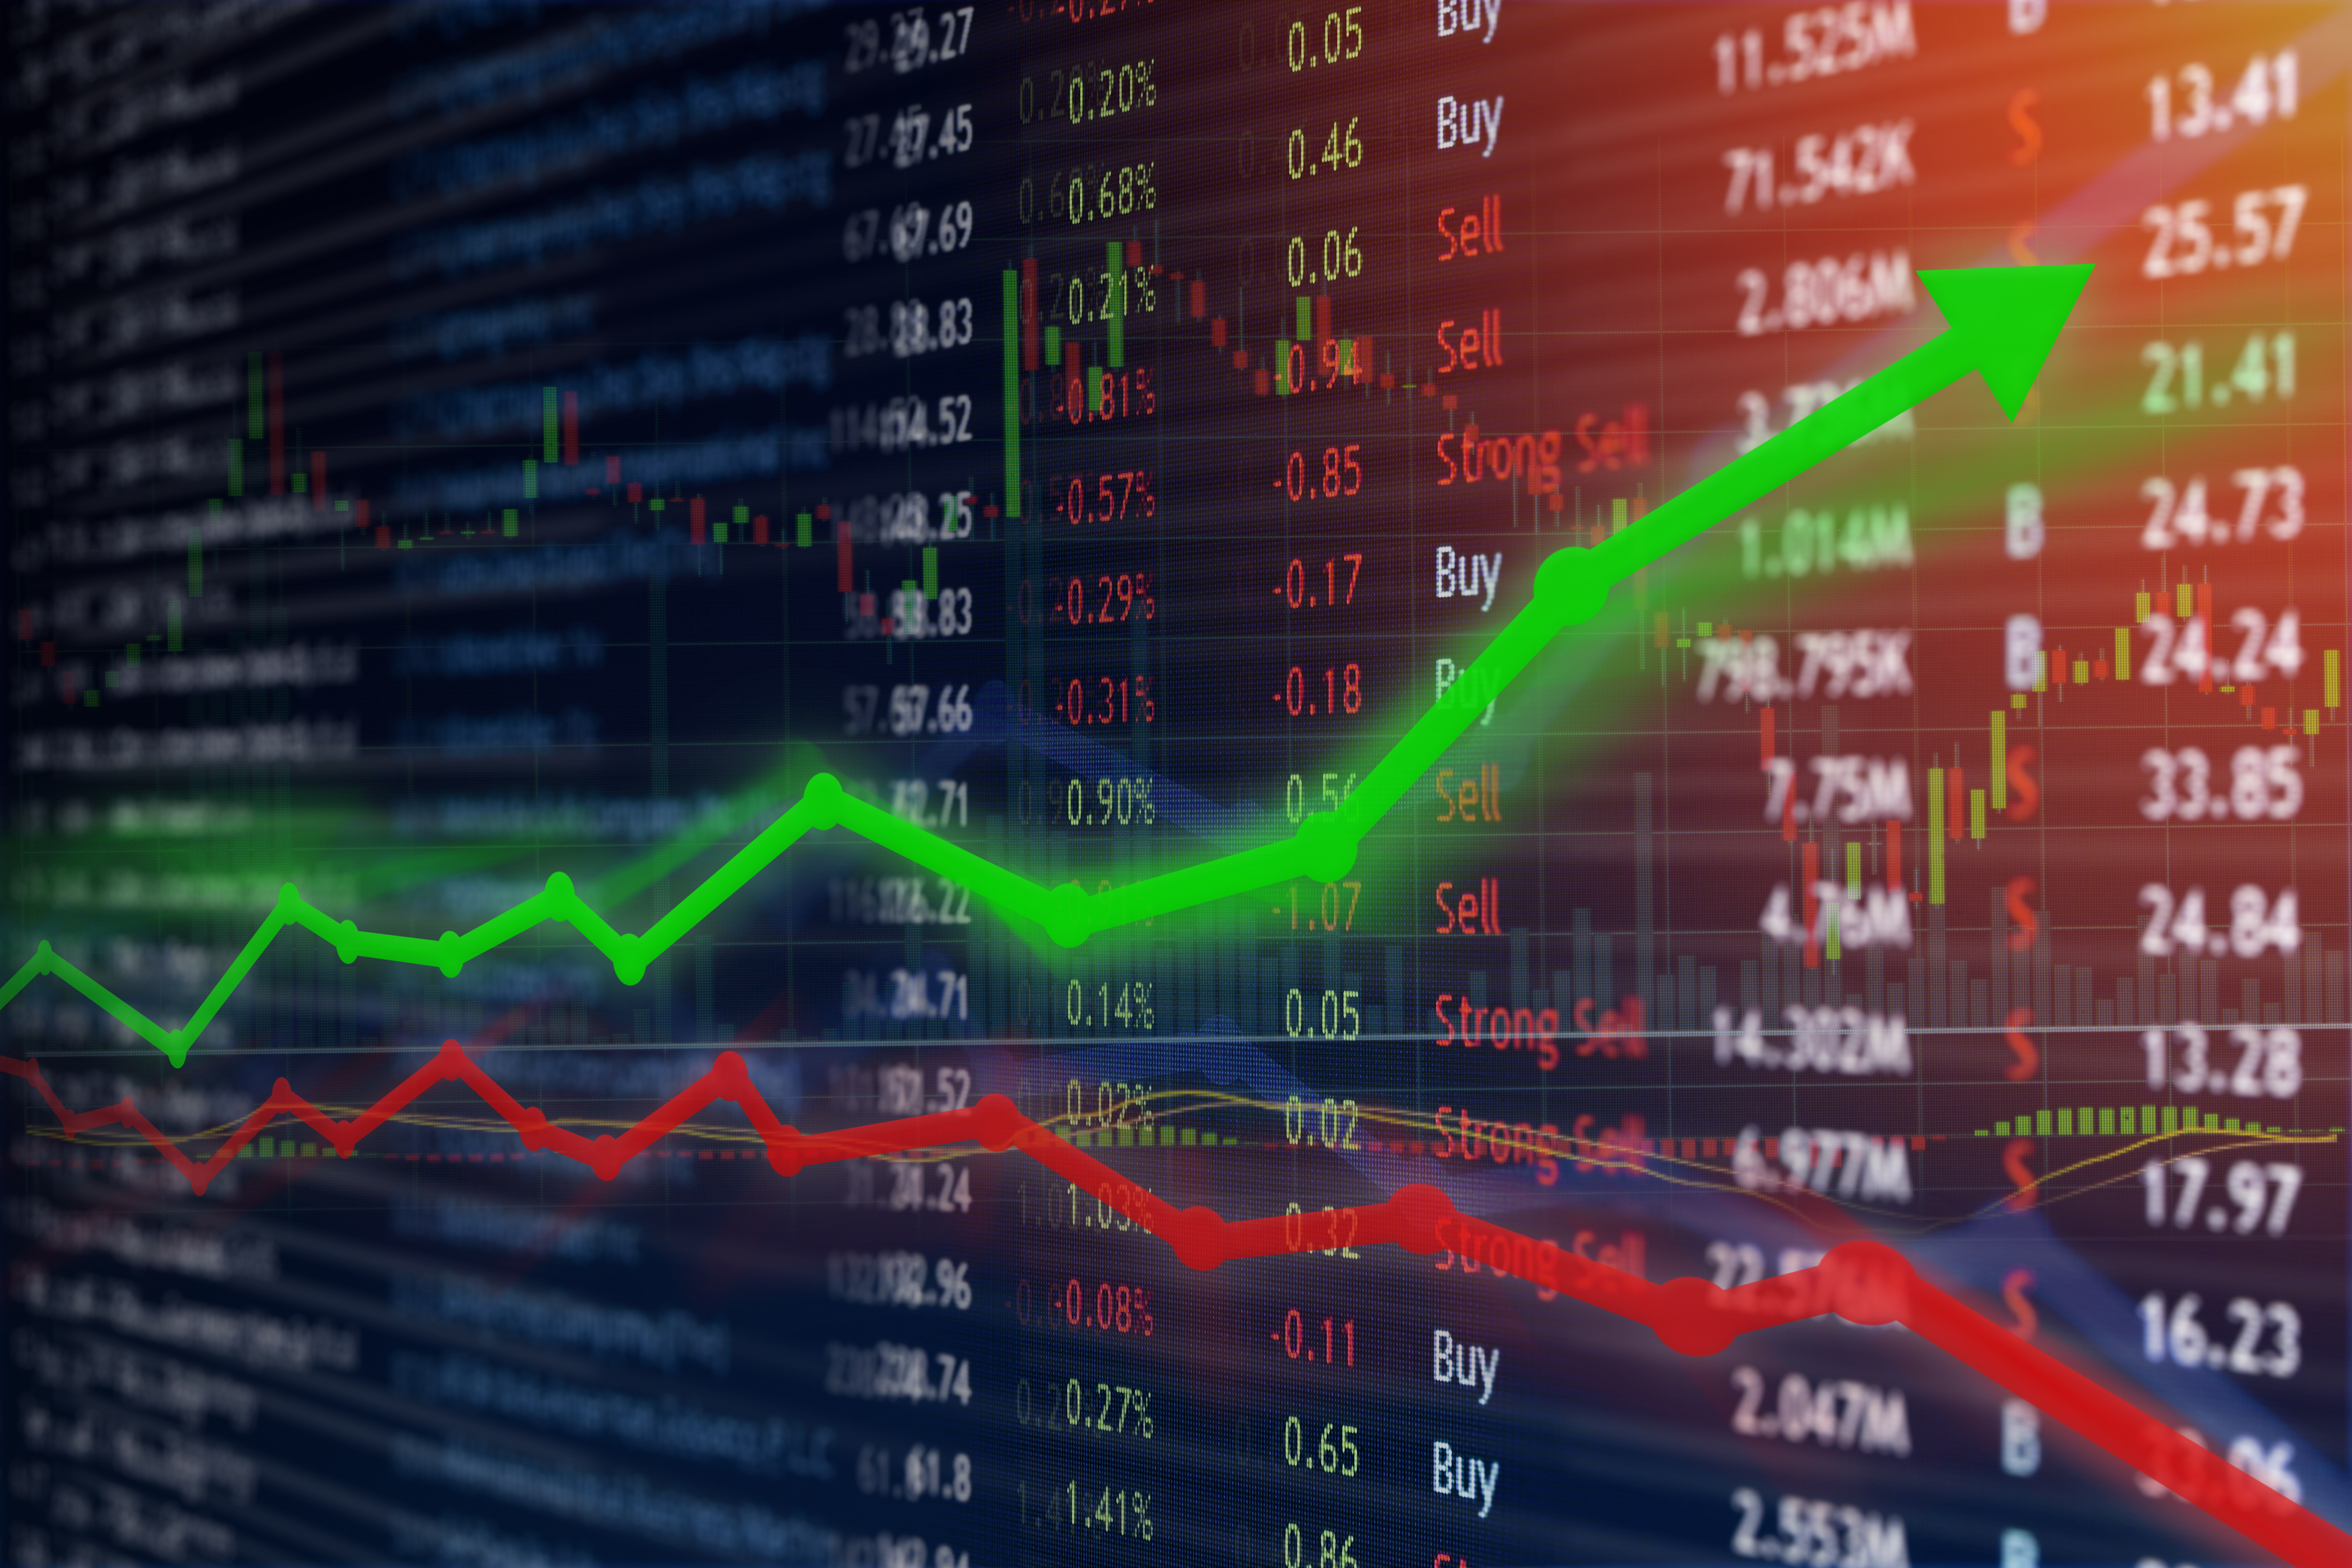
Volatile markets test the nerves and strategies of traders. Two popular and often opposite – approaches are momentum and mean reversion strategies. In simple terms:
- Momentum means buying assets that are rising and selling those that are falling riding the trend.
- Mean reversion means betting that prices will snap back to an average after extreme moves buying weakness, selling strength.
In this blog, we’ll break down both strategies, how they work, when to use them, and how they perform in volatile markets like the 2020 COVID crash or the inflation-driven swings of 2022.
What Is Momentum Trading?
Definition & Concept:
Momentum trading (or trend-following) is a strategy where traders buy assets that are already rising and sell (or short) those that are falling, assuming the trend will continue. It follows the principle of “buy high, sell higher,” aiming to capitalize on existing strength rather than trying to catch market bottoms. Momentum reflects the rate of price acceleration, driven by investor herding and strong bullish or bearish sentiment. It’s a technical approach, relying on price action and volume rather than fundamentals.
Why It’s Important:
Momentum investing has consistently delivered above-average returns and is considered one of the most successful market anomalies. It’s widely used by hedge funds, CTAs, and retail traders alike. The strategy thrives in strongly trending markets—when a stock has rallied over the past 3–12 months, it often continues to outperform. Since trends exist across all asset classes, mastering momentum enables traders to profit by simply identifying and riding those trends.
How Momentum Strategies Work
Momentum trading involves entering a trade in the direction of a strong trend and staying in as long as the trend continues. The two most common approaches are:
1. Time-Series Momentum
This strategy focuses on an asset’s own price history. Traders buy when the price breaks above a moving average or resistance level, and sell or short when it drops below a support level or moving average. For example, if a stock breaks above its 50-day moving average on strong volume, it signals bullish continuation and a trader might enter long. This approach often uses trailing stop-losses to lock in profits while allowing the trend to evolve.
Breakouts are considered part of this trend-following logic: if an asset breaks out of a consolidation range or previous high, it typically indicates strong momentum. A breakout above prior resistance on high volume is a signal that the trend may continue. Trend lines, moving averages, and volume confirmation are key tools here.
2. Cross-Sectional Momentum (Relative Ranking)
This involves comparing the performance of multiple assets. Traders rank assets based on recent returns and go long on the strongest performers while avoiding or shorting the weakest. For example, a strategy might long the top 10% of stocks based on 6-month returns and short the bottom 10%. This method is popular in quantitative models and factor investing, and works well in trending markets with sector rotation.
Common Indicators for Momentum
Momentum traders use trend-following tools and oscillators to assess the strength and direction of price movements. Key indicators include:
1. Moving Averages:
Used to filter trends—if price stays above a moving average, the asset is likely in an uptrend; if below, it’s in a downtrend. Crossovers like the 50-day crossing above the 200-day often signal momentum shifts.
2. Trend Lines & Chart Patterns:
Drawing upward or downward trend lines and spotting patterns like higher highs or lower lows helps visually confirm momentum direction. Successive higher highs often indicate bullish momentum.
3. Momentum Oscillators:
Tools like Rate of Change (ROC), Commodity Channel Index (CCI), and MACD measure the speed of price movement. A MACD crossover above its signal line suggests strengthening upward momentum; a crossover below implies weakening.
4. Average Directional Index (ADX):
ADX measures trend strength. Values above 25 indicate a strong trend—ideal for momentum trades. Values below 20 suggest a sideways or weak market. Traders often avoid momentum trades in low-ADX conditions.
5. Volume & Breakout Signals:
Volume spikes during price moves signal strong market participation, confirming momentum. Tools like On-Balance Volume (OBV) track whether volume supports the trend.
Pros of Momentum Trading
1. Potential for Large Gains:
Catching a strong trend early can lead to outsized returns. Letting winners run means a single big trade can outweigh many small losses. For example, in early 2022, trend-following funds delivered double-digit gains by staying short bonds and long commodities during inflation-driven volatility—while stock and bond markets declined.
2. Lower Trade Frequency:
Momentum traders only act when a clear trend is present, resulting in fewer trades and lower transaction costs. This approach reduces market noise and allows for more selective, high-conviction entries.
3. Emotionally Easier to Follow:
Momentum aligns with natural crowd-following behavior. It’s often easier to buy when prices are rising and confidence is high, rather than buying into weakness like contrarians do.
4. Broad Applicability:
Momentum strategies work across timeframes and asset classes—from intraday stock trading to long-term commodity trends. The approach is highly flexible wherever a trend can be quantified.
Cons of Momentum Trading
1. Vulnerability to Reversals:
Momentum is highly exposed to sudden trend reversals. Sharp market turnarounds—like the March 2020 COVID crash—can result in large losses as prior winners become losers. Momentum “crashes” often happen when long trends suddenly flip.
2. Fewer Winning Trades:
Momentum often has a lower win rate. Many trades may be small losers or breakeven, with profitability hinging on a few big winners. Traders must remain disciplined through these dry spells.
3. Struggles in Sideways Markets:
In choppy or range-bound conditions, momentum signals frequently fail. Trades get stopped out due to false breakouts, and the strategy suffers from repeated small losses in non-trending phases.
4. Requires Strong Risk Management:
Because reversals can be costly, risk control is critical. Techniques like volatility-based position sizing and dynamic exposure scaling are often used. Without strict stops and position limits, momentum trades can lead to large drawdowns.
What Is Mean Reversion Trading?
Definition & Concept:
Mean reversion is the opposite of momentum. It’s based on the idea that prices eventually return to their long-term average. Traders look for assets that have strayed too far from their recent mean—buying when oversold and selling when overbought—expecting a snap-back. For example, if the S&P 500 drops 20% in a month, mean reversion logic suggests it will likely bounce or at least decline less the following month. This approach assumes that markets overreact and will eventually correct themselves. In simple terms, it’s a “buy low, sell high” strategy.
Why It’s Important:
Mean reversion underpins many trading and investing strategies—from short-term swing trades to long-term value investing. It’s used in volatility trading (e.g., betting the VIX will return to average levels) and statistical arbitrage (e.g., pairs trading based on expected convergence). Since markets often oscillate around fair values, contrarian mean-reverting approaches offer frequent opportunities and typically deliver a high win rate. This strategy encourages patience and discipline, making it a useful complement to trend-following methods.
How Mean Reversion Strategies Work
Mean reversion traders seek price extremes situations where an asset has strayed far from its typical value and take the opposite side, betting on a return to the average. Here are the most common tactical approaches:
1. Reversal Trading: Oversold Bounces & Range Setups
This is the most basic and widely used form of mean reversion. Traders buy after sharp drops or sell after sudden rallies, expecting a bounce back toward the mean.
- In oversold bounce setups, entries are triggered after steep short-term declines—like three down days or a 2-standard-deviation drop. Tools like RSI (below 30) or Bollinger Bands (price hitting lower band) help signal entry. For instance, in October 2022, several tech stocks reached RSI lows and rebounded within days.
- In range trading, price repeatedly oscillates between defined support and resistance zones. Traders buy near support and sell near resistance. For example, if a stock moves between ₹50 and ₹60, a mean reversion trader can exploit that recurring cycle.
Both tactics rely on the idea of price normalization, but differ slightly in timeframe—bounces are usually quicker, while range plays require more patience.
2. Pairs Trading (Statistical Arbitrage)
This involves taking opposite positions in two historically correlated assets buying the underperformer and shorting the outperformer expecting their price relationship to converge. For example, if gold surges while silver lags, a trader might short gold and buy silver. This method relies on statistical signals like z-scores and avoids directional market bias.
3. Volatility Mean Reversion (Options-Based Strategies)
Volatility tends to revert over time. Traders often sell options (or volatility products) when implied volatility spikes such as a VIX surge expecting it to drop as fear subsides. When volatility is unusually low, they might buy options anticipating a future increase. This is a common approach in options, derivatives, and volatility-focused funds.
4. Fundamental Mean Reversion (Value Investing)
Over longer horizons, value investors look for fundamentally strong but temporarily undervalued stocks. After sharp declines due to panic, earnings misses, or external shocks these stocks are expected to recover as sentiment normalizes. For instance, during the COVID-19 crash or the 2008 financial crisis, investors who bought beaten-down but solid companies saw strong long-term rebounds.
Common Indicators for Mean Reversion
Traders use various tools to identify when prices have moved too far from their average and are likely to revert:
1. Oscillators (Overbought/Oversold Indicators):
The Relative Strength Index (RSI) and Stochastic Oscillator are widely used. RSI values above 70 indicate overbought conditions (potential sell), while values below 30 suggest oversold (potential buy). The Stochastic Oscillator works similarly, with thresholds typically at 80 (overbought) and 20 (oversold). These indicators help quantify how stretched the market is.
2. Bollinger Bands:
These bands sit two standard deviations above and below a moving average. When price touches the upper band, it may signal overbought conditions; the lower band suggests oversold. Traders look for a price return toward the middle band and often seek confirmation from other indicators or candlestick patterns.
3. Moving Average Deviation / Z-Scores:
Some strategies calculate how far price is from a moving average in standard deviations. A Z-score beyond ±1.5 or ±2 signals an unusually stretched move. For instance, if a stock is 2.5 SDs above its 50-day average, it may be a short candidate. This is commonly used in algorithmic trading to trigger mean reversion entries.
4. Sentiment & News-Based Contrarian Signals:
Extremes in market sentiment—such as panic selling, high put/call ratios, or excessive bullishness—often precede reversals. Tools like the Fear & Greed Index or public reaction to news can signal crowd overreaction. For example, when a strong company’s stock crashes on one-time bad news (e.g., CEO exit), contrarians may buy in anticipation of recovery. A notable case was Infosys, where shares rebounded after panic selling post-resignation.
Pros of Mean Reversion Trading
1. High Win Rate & Steady Profits:
Mean reversion strategies often have win rates above 60–70%. Since trades typically involve buying low and selling on the bounce (or shorting the peak and covering on a dip), many result in small but consistent gains. This makes it attractive for traders seeking smoother equity curves and reliable returns.
2. Frequent Opportunities:
Markets frequently move sideways, creating numerous chances to exploit price swings. Mean reversion thrives in such range-bound conditions. Unlike momentum traders who may wait out consolidations, mean reversion traders can repeatedly profit from minor reversals within those ranges.
3. Defined Risk on Entries:
Because trades are entered at perceived extremes (near support/resistance), stop-losses can be placed tightly around those levels. This keeps individual trade losses small and manageable, making risk easier to control compared to momentum strategies that require wider stops.
4. Effective in Panic or Euphoria:
Extreme sentiment often creates reversion setups. For example, the March 2020 COVID crash offered lucrative rebound opportunities for those who bought into oversold conditions. Similarly, fading unsustainable rallies—like the 2021 meme-stock spike—can be highly profitable.
5. Intuitive Appeal:
The “buy low, sell high” logic of mean reversion resonates with traditional investing wisdom. It feels natural for contrarian thinkers and value-driven traders who prefer to act when others are overreacting.
Cons of Mean Reversion Trading
1. Limited Upside & “Fat Tail” Risk:
This strategy generally targets modest price moves. While win rates are high, the occasional large loss—when price fails to revert—can erase many small gains. A single outlier move can significantly damage performance if not properly managed.
2. Markets Can Stay Irrational:
Even when a reversion seems due, prices may continue to overshoot. In trending markets, mean reversion traders can get steamrolled. If capital or patience runs out before a reversal, losses can mount quickly.
3. False Signals & Regime Changes:
What appears to be an overextended move might actually be the start of a new trend. In such cases, fading the move backfires. For instance, treating every dip as a buying opportunity during a true bear market—like in 2022—led many traders to repeated losses.
4. Psychological Difficulty:
Going against the crowd can be emotionally tough. Buying when everyone is fearful or selling during euphoric rallies requires discipline and conviction. The fear of “catching a falling knife” or missing out can lead to poor execution or premature exits.
5. Higher Transaction Costs & Effort:
Frequent entries and exits increase transaction costs and require constant monitoring. Unlike momentum trades that may run for weeks, mean reversion setups demand active management and quick decision-making, which can be taxing and costly over time.
Momentum vs. Mean Reversion: Key Differences
Now that we’ve defined each strategy, let’s compare them side by side. Momentum and mean reversion are almost mirror opposites in philosophy. Here are the key differences:
| Feature | Momentum Trading | Mean Reversion Trading |
| Market Conditions | Best for trending markets (sustained up or down moves) | Best for range-bound or sideways markets (oscillating prices) |
| Core Assumption | Trends will persist – recent winners keep winning | Prices revert to the mean – extremes will normalize |
| Trade Frequency | Lower – fewer trades, only on clear trends | Higher – frequent trades on each swing back to mean |
| Holding Period | Longer-term holds (days to months) | Short-term holds (hours to weeks) |
| Profit per Trade | Potentially large – catch big moves (“fat right tail”) | Smaller per trade – incremental gains, many times |
| Win Rate | Variable or lower (~40–50%) – many small losses | Often higher (>60%) – many small wins |
| Risk & Drawdowns | Risk of big losses if trend reverses (momentum crash) | Risk of repeated losses or one large loss if price fails to revert |
| Stop-Loss Approach | Wider or trailing stops – to let trend develop | Tighter stops near extremes – quick exit if price breaks away |
| Examples | Trend-following CTAs, breakout buying, momentum stock rotation | Pairs trading, “buy the dip,” fading overbought rallies |
Using Each Strategy in Volatile Markets️
Volatility brings both opportunity and risk. Momentum and mean reversion strategies can each succeed in turbulent markets—depending on the type of volatility.
Momentum in Volatile Markets
1. Trending Volatility (Directional):
Momentum thrives when volatility is paired with strong directional moves.
Example: In 2022, as inflation spiked and central banks raised rates, stocks and bonds trended down while commodities surged. Trend-following funds profited by shorting weak sectors and riding commodity booms. Similarly, during the 2008–09 crisis, momentum strategies gained by shorting the crash and later going long on the recovery.
2. Whipsaw Volatility (Non-Directional):
When volatility leads to rapid reversals instead of trends, momentum fails.
Example: During the COVID crash (March 2020), markets fell sharply and rebounded violently. Momentum traders were caught on the wrong side of both moves—leading to what’s known as a “momentum crash.” Rapid reversals gave multiple false signals with no follow-through.
3. Adapting Momentum to Volatility:
Advanced traders manage this by:
- Scaling down positions during high volatility
- Using trend filters (like ADX) to avoid choppy periods
- Switching to mean reversion when volatility spikes
Mean Reversion in Volatile Markets
1. Exploiting Overreactions:
Volatile markets often produce extreme oversold or overbought levels.
Example: During March 2020, stocks hit historic lows on RSI and Bollinger Bands. Contrarians who bought the dip saw quick, powerful rebounds. Similar profits came from shorting overstretched rallies, like Meta’s 25% one-day drop in 2022.
2. Danger of “No Reversion”:
Mean reversion fails when volatility is part of a lasting trend or regime shift.
Example: In 2022, buying dips in growth stocks repeatedly failed as markets stayed bearish. Traders expecting a return to past highs were met with further declines.
3. Volatility Regime Considerations:
Tools like the VIX help identify when to apply mean reversion:
- High spikes may signal bottom-fishing opportunities
- Gradual, trend-driven volatility may require staying out or using options strategies (e.g., selling puts in a panic)
Key Takeaway
- Sharp, fast reversals (e.g., V-shaped crashes and rebounds) favor mean reversion
- Sustained trending volatility favors momentum
Smart traders adapt based on market conditions. Many use hybrid models that switch between strategies depending on indicators like volatility levels or trend strength. This adaptive approach, supported by research, outperforms static strategies—especially in unpredictable markets like those seen in 2020 and 2022.
Conclusion
Volatile markets are unpredictable, but not unmanageable. Momentum and mean reversion strategies offer traders two distinct but powerful ways to approach uncertainty one rides the trend, the other fades extremes. Both can be profitable, but their success hinges on applying the right one under the right conditions. In choppy, whipsaw markets, mean reversion often outperforms. In directional, trend-driven environments, momentum tends to lead.
But timing strategy shifts, managing risk, and staying disciplined isn’t easy, especially without the right tools.
That’s where Hedged come in. Designed for today’s dynamic markets, Hedged enables retail investors and active traders to think beyond static strategies. Whether you’re following momentum, identifying mean-reverting setups, or just trying to reduce downside risk in uncertain times, Hedged helps simplify execution. From strategy insights to volatility-aware tools, it equips you to make smarter, more confident decisions.
In a world where the markets can flip from trend to panic in a week, staying flexible is no longer optional — it’s your strongest hedge.
Leave a Reply